Are you looking for some infographic design ideas to inspire you?
I’m sure you’ve heard about the rise of infographics. Data-based visual representations of information, these graphics are quickly becoming an effective way for businesses and organizations to share their knowledge with the public. The infographic design ideas in this top 10 list will inspire you to create eye-catching infographics to engage your audience.
We’ve got you covered with top 10 infographic design ideas.
Infographics are a great way to convey complex data visually and engagingly, perfect for social media. This post will walk you through 10 ways to create infographics for your business.
In this list, you will find practical infographic design ideas. These tips will help you create eye-catching infographics that will engage your audience and help you achieve your goals.
Find the perfect design for the following infographic.
The process of creating infographics is not always easy. It can become overwhelmed in the competitive world of journalism and blogging, where pages compete for attention and clicks. From selecting a topic to finding an appropriate design, you need to consider many steps.
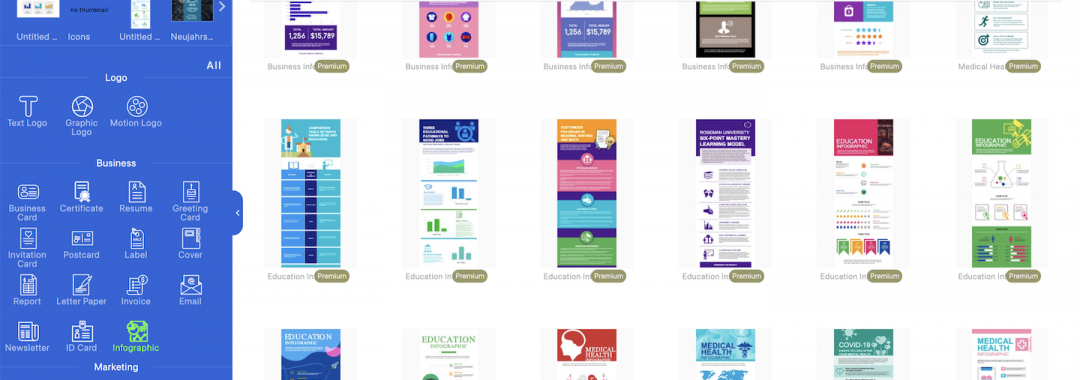
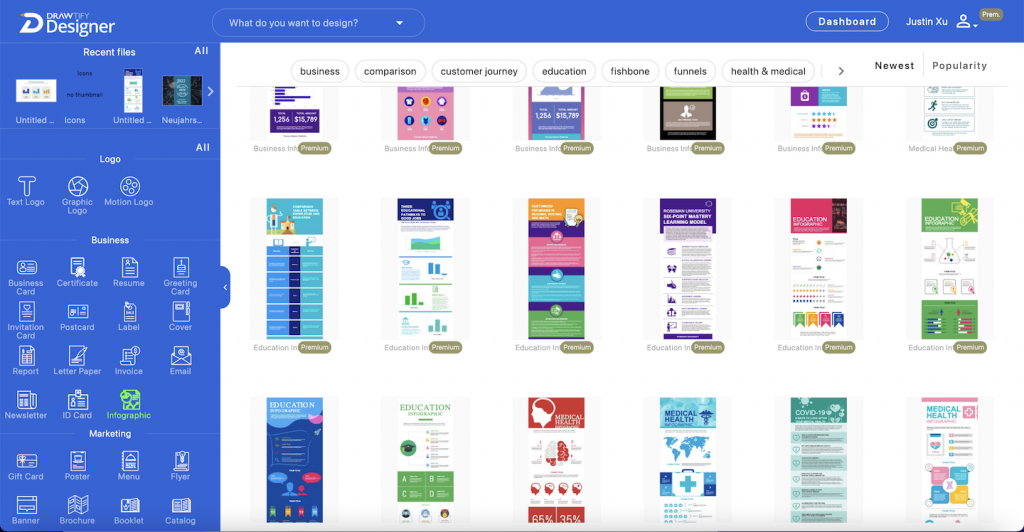
A new service called Drawtify Infographic Maker is here to help. Drawtify will provide a variety of designs for infographic creators to choose from. Professional graphic designers who have been operating for over 15 years create these designs.
Check out our top 10 infographic design ideas to inspire you!
Infographics are a great way to present information in a format that’s easy to understand. They’re an attractive visual medium that’s becoming more and more popular, so we’ve compiled this list of the best infographic design ideas from around the web.
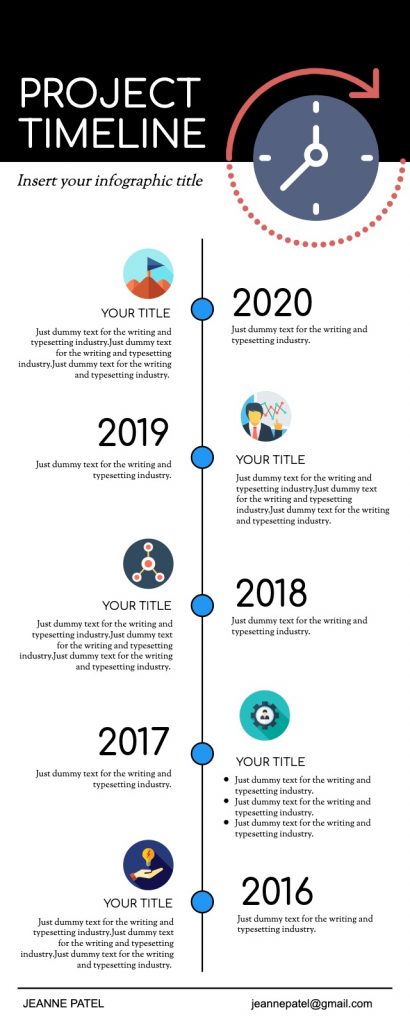
Timeline Infographic Templates
The timeline infographic is a great way to show your readers the sequence of events that led to an event. This infographic is perfect for showing how your business has evolved or showing the history of a product or service.
Timeline Infographics are a type of infographic that show the chronological order of events. They are often used to show the history of a company or product. It is a simple way to tell the story of an event or product.
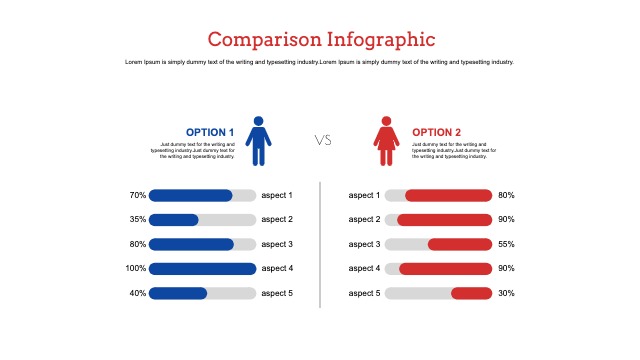
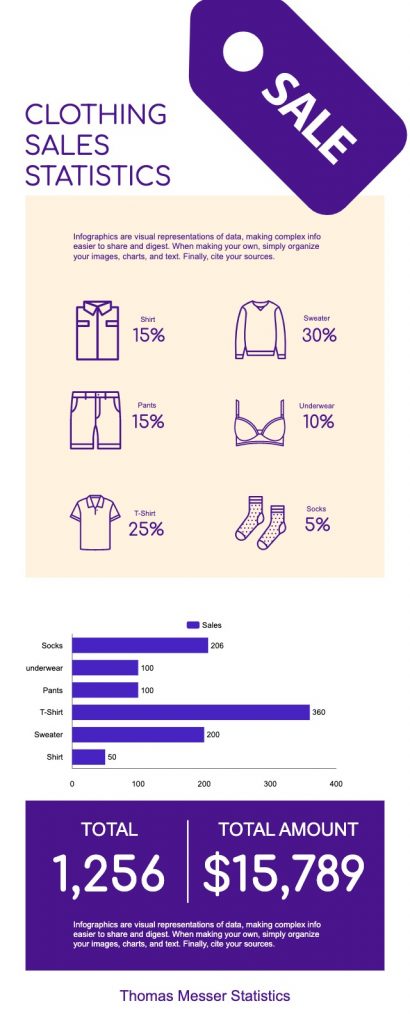
Comparison Infographic Templates
Comparison infographics are a type of infographic that compares two or more items. They show the differences and similarities between two or more things.
You can use comparison infographics in many different ways. They compare two products, a car, and a motorcycle, to show how they differ in features and price. Another way is to compare two people, like Barack Obama and Donald Trump, to show how they differ in their political views.
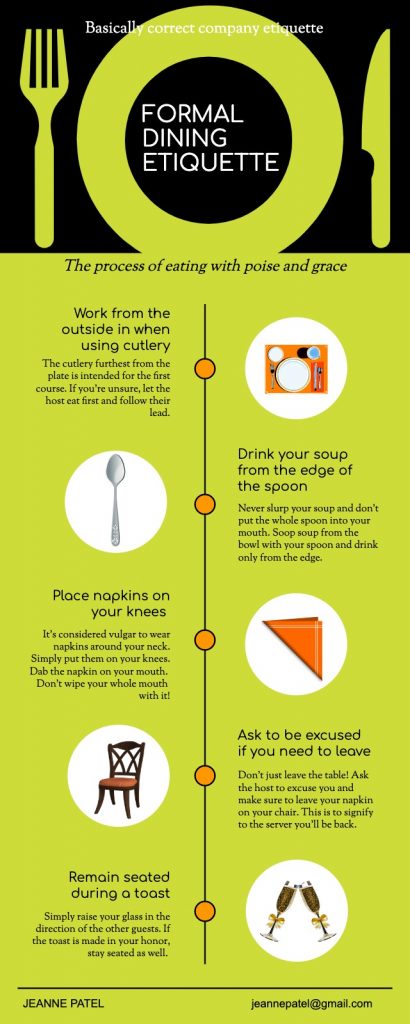
Process Infographic ideas Templates
Process Infographics are a great way to show the process of a company, organization, or individual. They are also a great way to show how the process works and what it entails.
A Process Infographic is an infographic that shows the process of something. It can be anything from making coffee to how a company operates. The Process Infographics are easy for people to follow and understand what they’re looking at it.
Companies often use process Infographics as marketing tools to showcase their processes.
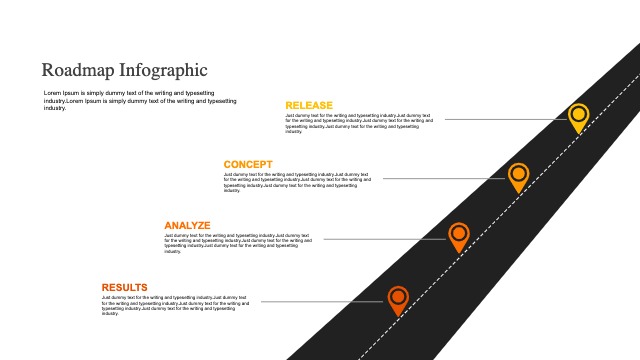
Roadmap Infographic Templates
Roadmap Infographics are a visual representation of the steps in a process. They are used to show the timeline of events and how they relate to each other.
Typically we create roadmap infographics with timelines, milestones, and tasks. The timeline shows horizontal bars representing different stages in the process. Milestones are points in time where significant events happen or reach them. Tasks are individual steps that need to be completed to finish the project.
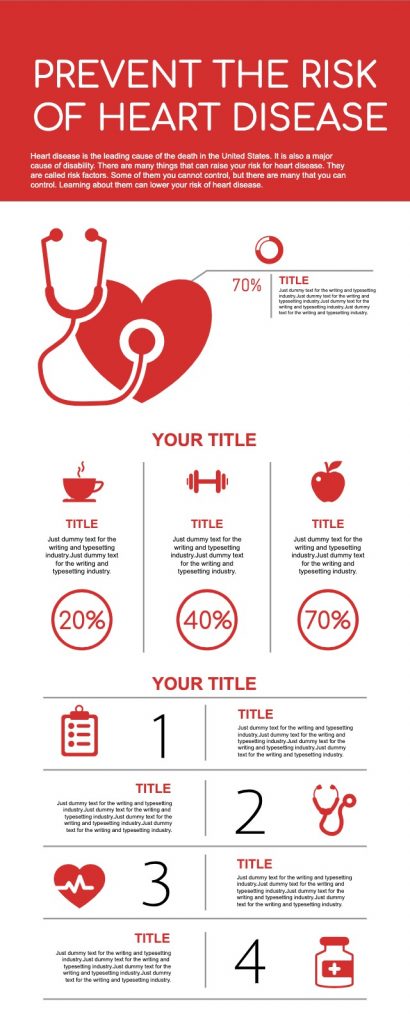
Health Infographic Poster ideas Templates
Health infographics are visual representations of data used to educate people on a specific topic. We usually create it in the form of a poster, infographic, or diagram.
You can create health infographics in posters, infographics, or diagrams. A health infographic is a graphic representation of information about health and wellness. You can use them to educate people about various topics related to health and wellness.
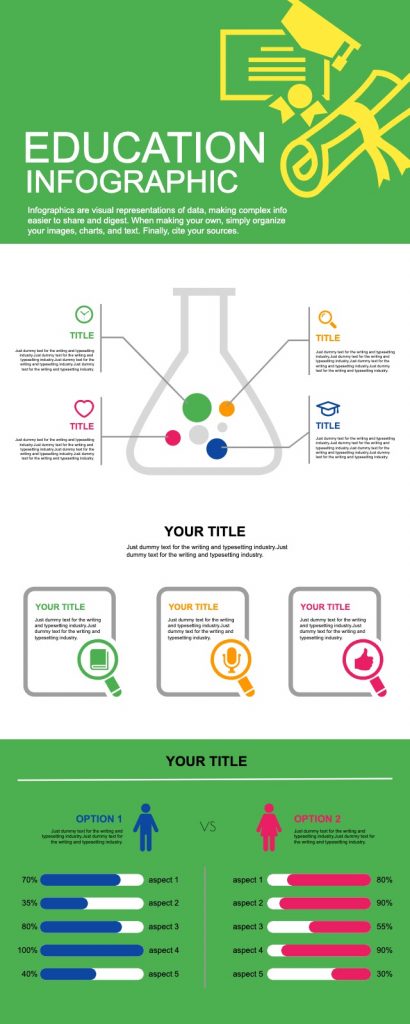
Education Infographic Layout ideas Templates
Education infographics are a great way to share information about education with others in an easy-to-understand format. You can use them for various purposes, including teaching, research, and marketing.
Infographics are used in the classroom to teach visual literacy skills. They are also used to help students understand complex topics by making them more exciting and engaging.
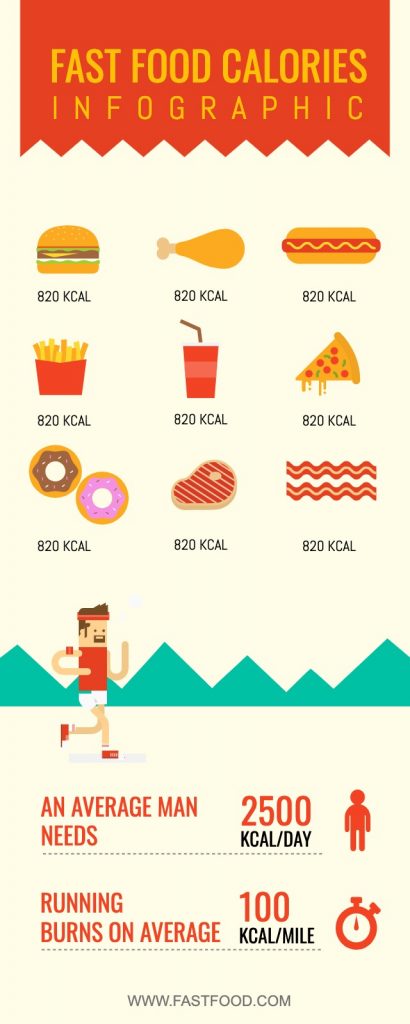
Food Infographic Topic ideas Templates
Food infographics can help readers understand the nutritional content of food and its health benefits. They can also be an excellent way for brands to promote their products by providing exciting and educational content.
A food infographic is an illustration that displays information about a specific food. The infographic may also include information about the health benefits of the food and may also have recipes for cooking the food.
Business Infographic ideas Templates
Business infographics are a powerful communication tool that tells your story visually and helps you make an impactful point. A business Infographic is a visual representation of data. It is a graphical way to represent information in an easy-to-understand format. And use it for marketing, education, research, and more.
You can use Infographics to make complex data easier to understand and remember. Or share your content engagingly as a marketing tool.
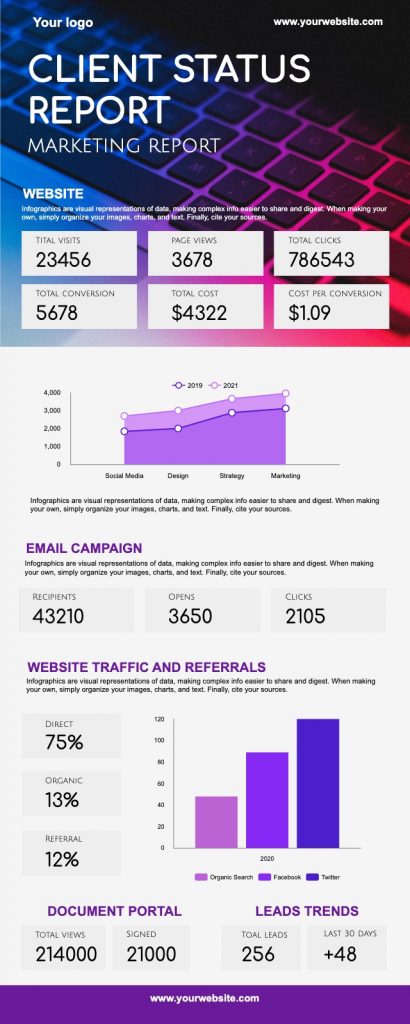
Marketing Infographic Layout ideas Templates
Marketing infographics are a great way to make your marketing campaign more effective. They provide a visual representation of the data and information you want to share with your audience.
Infographics are a great way to make your marketing campaign more effective. They provide a visual representation of the data and information you want to share with your audience.
You can use infographics for many purposes, such as:
- Illustrate complex concepts
- Show trends in data
- Compare different aspects of something
- Show how something works
- Summarize research findings
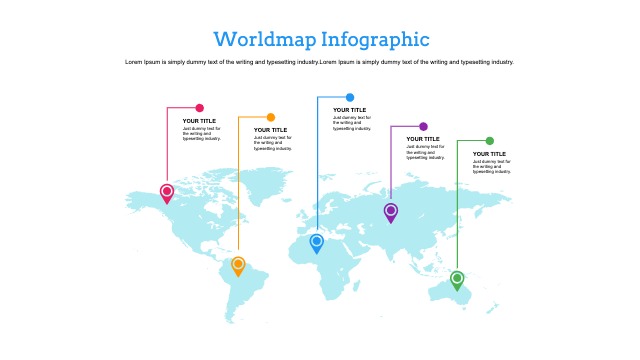
Worldmap Infographic Design Templates
Worldmap Infographic is a new way of mapping the world. It is a visual representation of the world based on data from the United Nations. The UN created the Worldmap Infographic to provide an accurate and up-to-date visualization of where people live, work, and move around.